Server, network and uptime monitoring built for MSPs
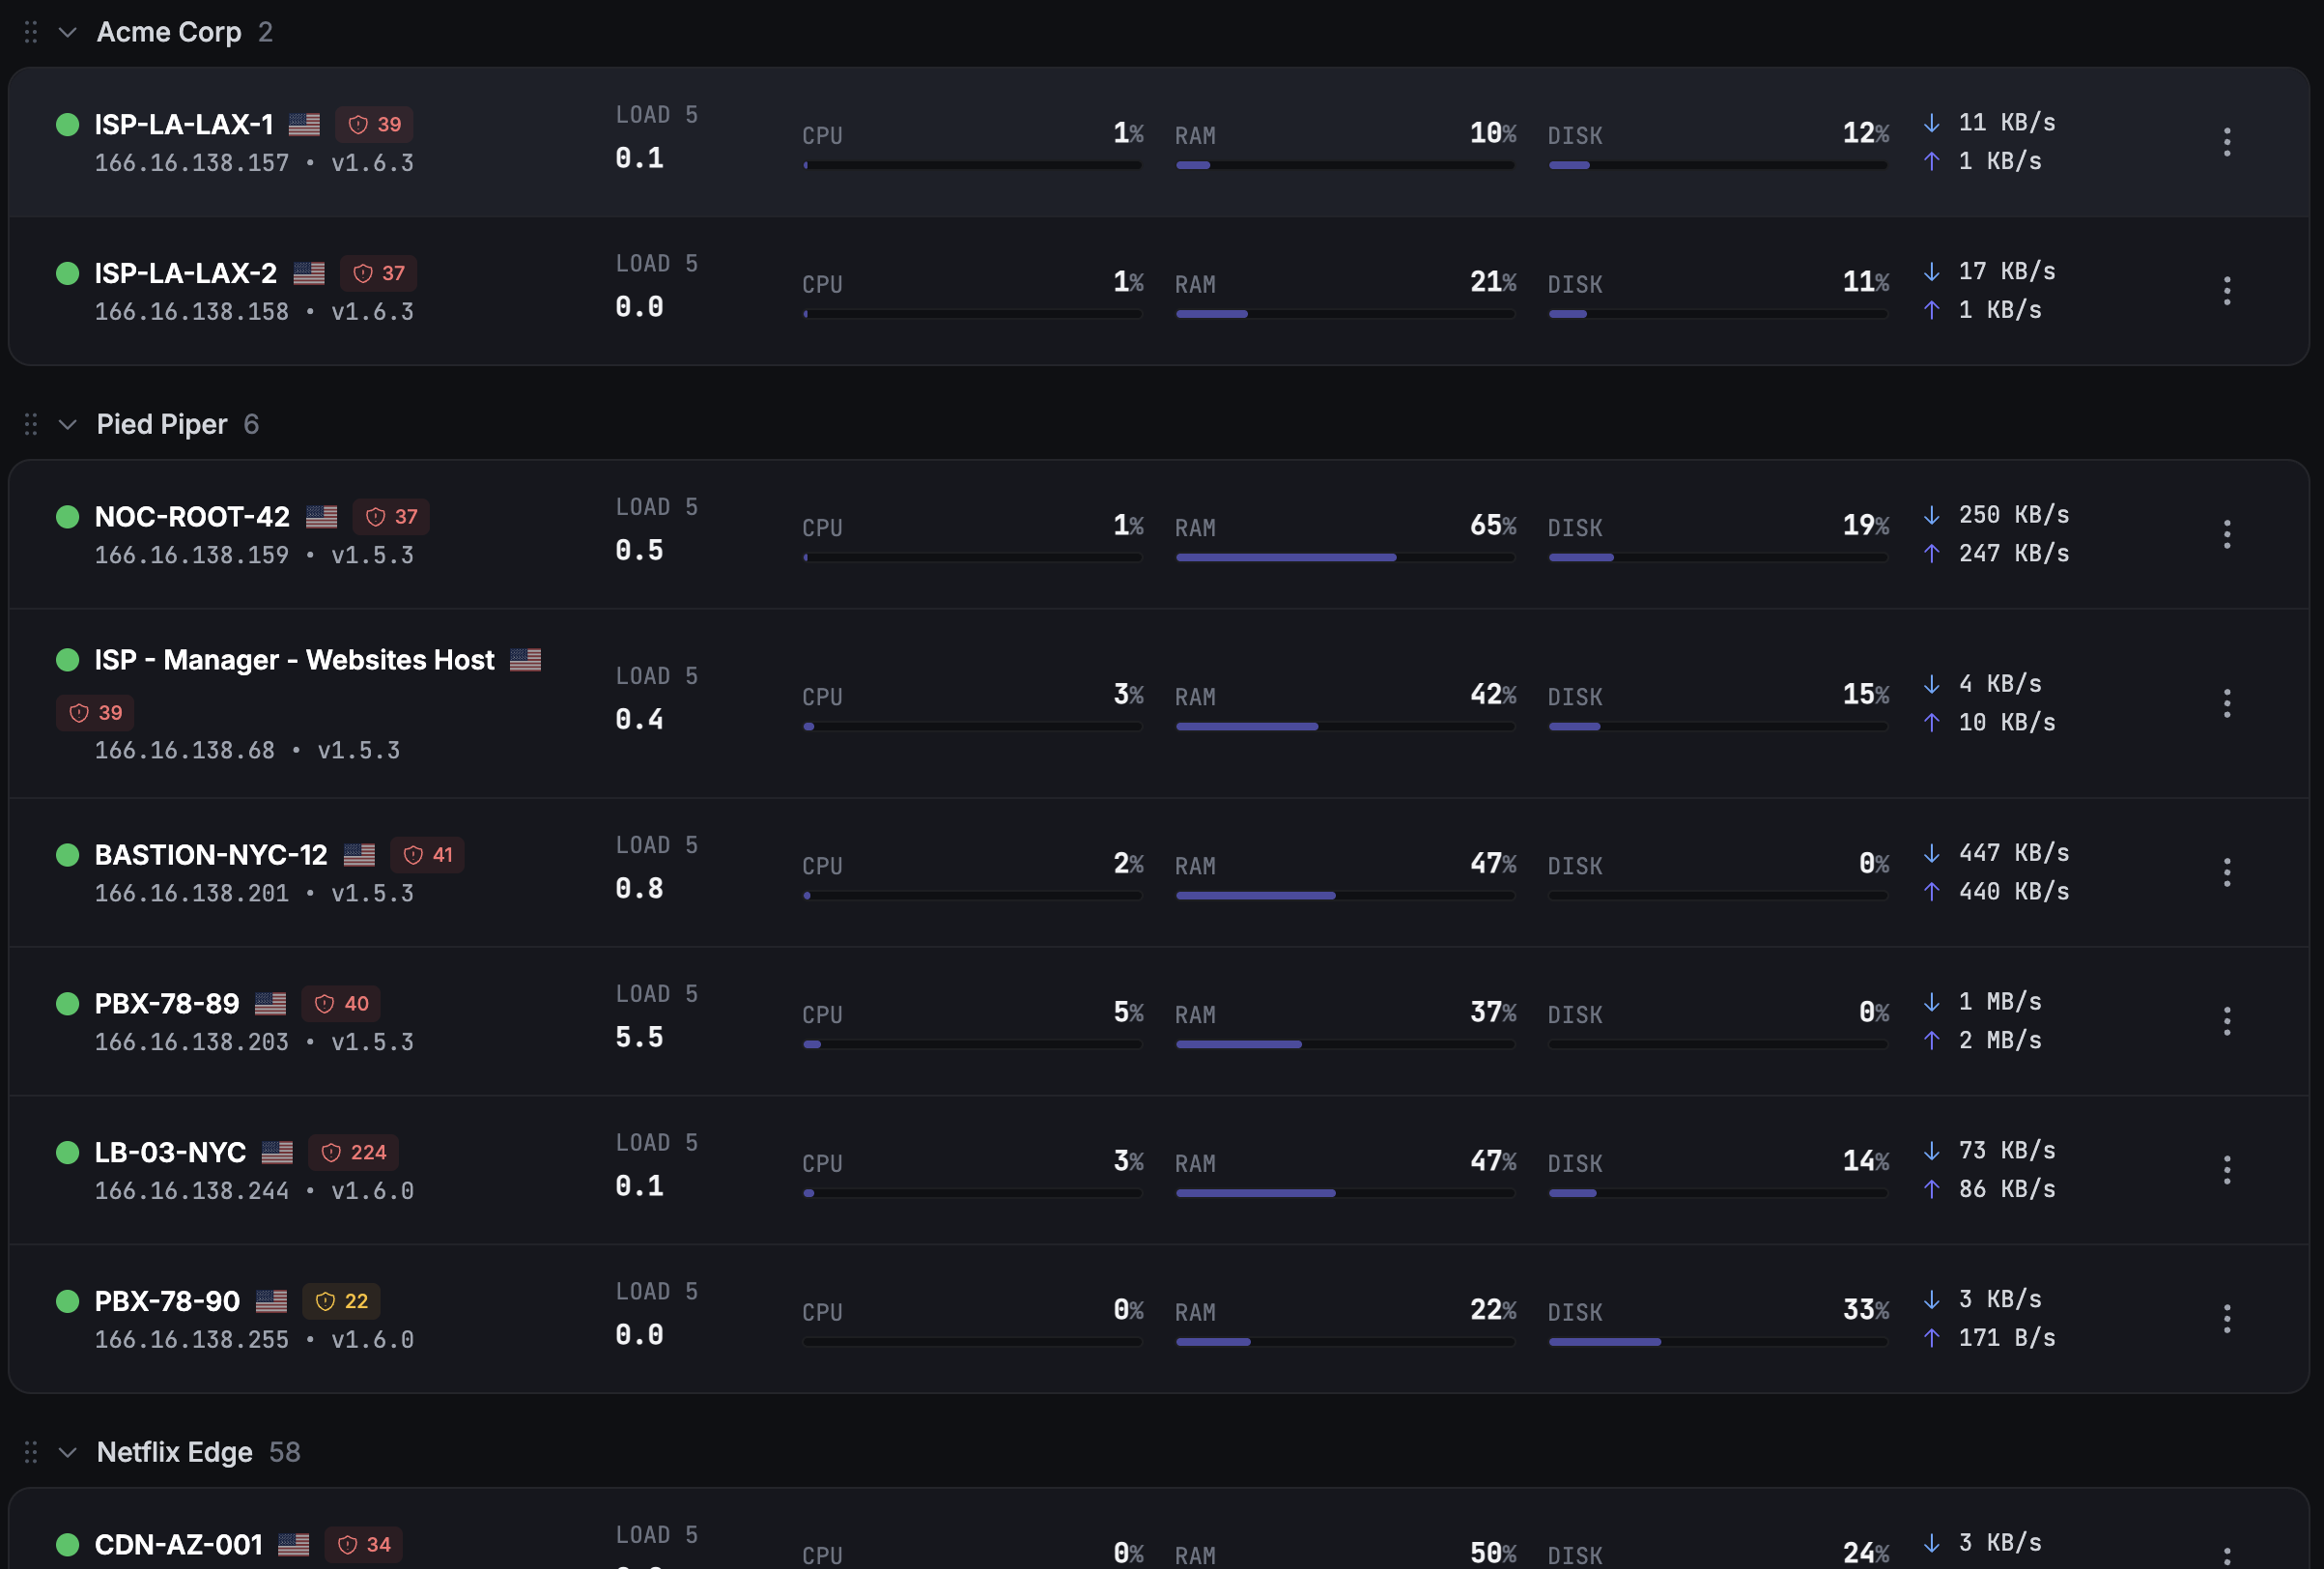
Replace your RMM's blind spots and Auvik's price tag. Monitor every client's servers, switches, firewalls, websites and cron jobs from one dashboard, starting at €49 per month.
Used by MSPs running 50 to 500+ servers across client fleets
No credit card · Live in 2 minutes

“Fivenines was monitoring 100+ of our servers in 40 minutes. During a recent service disruption, it was the only platform that actually pointed us to the root cause. We're now at 300+ servers monitored, and we use Fivenines as part of our sales pitch with new clients.”
Daniel Preni Systems Engineer at Southeast Networks
Before
Zabbix + CheckMK
Multiple tools · Manual sync · Hours of config
After
Fivenines
One platform · 300+ servers · Client-facing differentiator
- 40 min
- to deploy
- 300+
- servers monitored
- 1
- Unified platform
Built for MSPs who...
If three or more of these lines feel familiar, this page is for you.
-
Run client fleets of 50 to 1000+ servers
Linux distros (Ubuntu, Debian, Raspbian, Rocky, AlmaLinux, Arch, CentOS) and Windows Server. You want 60-second metrics by default without standing up Prometheus and Grafana for every client.
-
Client fleet organization
Group servers, monitors and network devices by client so every fleet, alert stream and status page stays easy to find.
-
Server and network in one platform
Monitor Linux and Windows servers through the open-source agent, then add switches, routers and firewalls through SNMP.
-
Watch the databases behind client apps
PostgreSQL and MySQL/MariaDB each get a reachability alert that tells a refused connection apart from a wrong credential, with Galera cluster state for clustered MariaDB. RabbitMQ queues alert on backlog depth and on consumers disappearing, and Redis and Memcached report their own metrics for threshold alerts.
-
Alert when a service stops, not just when the box does
Point systemd monitoring at the units that matter on each client host and get paged when one goes failed. A stopped queue worker or a crashed nginx.service is invisible to a ping check and to CPU graphs.
-
Know when a client tunnel goes dark
A dead tunnel means a blind client site: everything behind it stops reporting and nothing looks broken. WireGuard peers are watched by handshake age on Linux hosts, and Tailscale nodes by key expiry, the failure that silently drops a machine off the tailnet with no error anywhere on the box. See VPN monitoring.
-
Cover the Proxmox hosts running client workloads
Cluster quorum, node availability, guest state and storage pools, with one incident per real problem instead of one per node that noticed it.
-
White-label status pages
Publish branded status pages on your MSP's domain with real-time uptime, incident history and scheduled maintenance.
-
Route alerts by client and severity
Use workflows to send level-1 noise to Slack, after-hours incidents to Telegram, and dispatch events through webhooks.
-
Track uptime, SSL and cron jobs together
Keep websites, certificates, scheduled jobs and server metrics in one place instead of stitching together overlapping tools.
-
Per-client SLA reporting
Export uptime and incident data per client, per service and per period for QBR decks, PSA invoicing or compliance reports.
-
Package vulnerability scanning
Get a patch list per client, not a CVE count: the headline is the packages with a fix available, and anything with no upstream patch is listed on its own with Canonical, Debian or Red Hat's stated reason. Container images are scanned too, so a stale base image cannot hide behind a patched host.
Trusted by MSPs and hosting providers worldwide









Fivenines vs Auvik, LogicMonitor and NinjaOne RMM
Most MSPs run two or three monitoring tools at once: an RMM for endpoints, a network monitoring tool for switches and routers, and an uptime checker for client-facing websites. Fivenines collapses that stack into a single platform, at a fraction of the cost.
| Capability | Fivenines | Auvik | LogicMonitor | NinjaOne RMM |
|---|---|---|---|---|
| Server metrics (60s default) | Open-source agent | Not native | Agent-based | 60s+ |
| SNMP network monitoring | Included | Included | Included | No |
| Uptime + SSL monitoring | Included | No | Add-on | No |
| Cron job monitoring | Included | No | No | Limited |
| Package vulnerability scanning | Linux package CVEs | Network monitoring focus | Observability focus | Endpoint vulnerability management |
| Public REST API | Full CRUD | Read-mostly | Included | Included |
| Terraform provider | Included | No | No | No |
| White-label status pages | From €49/mo | No | Enterprise | No |
| Client fleet organization | Included | MSP-focused | MSP edition | Per-org only |
| Open-source agent | Yes | No | No | No |
| Transparent pricing | Self-serve | Quote-only | Quote-only | Quote-only |
| Starting price | €49/mo | $150+/mo | $$$$ enterprise | $/endpoint |
| Time to first monitored server | 2 minutes | 15 minutes | Hours | Hours |
How MSPs onboard a new client in under 30 minutes
Forget multi-week deployments. Most MSPs onboard a new client end-to-end before lunch.
Minute 0 to 5
Install the open-source agent on every server
One command via SSH (Linux) or PowerShell (Windows), or run it through Ansible or your config management of choice. Metrics start flowing in 60 seconds. No reboot. No package conflicts. No firewall rules to argue about.
wget -qO- https://releases.fivenines.io/latest/fivenines_setup.sh | sudo sh -s ENROLLMENT_TOKEN
✓ Agent installed. Sending metrics... [acme-prod-01]
Minute 5 to 15
Add network devices via SNMP
Add the client's switches, routers, firewalls and access points with their SNMP settings. Metrics are collected and aggregated once the devices are configured.
Minute 15 to 25
Configure per-client alert routing and white-label status page
Group monitors by client. Route alerts via email, Slack, Microsoft Teams, Telegram, Discord, Pushover, PagerDuty or webhook. Publish a branded status page on your subdomain in two clicks.
status.acme-corp.com
All systems operational
Day 7
Export the first monthly SLA report
Pull a clean CSV per client showing uptime, incident count and MTTR. Drop it into a QBR deck, an invoice or your PSA.
Predictable pricing that scales with your client base
Most MSPs start on Pro or Business. No per-device pricing that explodes as you onboard clients. No annual commitment required. No "talk to sales" before you can see numbers.
Pro
For MSPs with up to 5-10 clients
- ✓50 monitors
- ✓10 team members
- ✓White-label status pages
- ✓Vulnerability scanning
- ✓12 months data retention
Business
For MSPs with 10-25 clients
- ✓100 monitors
- ✓25 team members
- ✓Everything in Pro
- ✓PagerDuty and webhook alerts
- ✓24 months data retention
- ✓SAML SSO
Enterprise
For MSPs with 25+ clients or NOC teams
- ✓300+ monitors
- ✓50+ team members
- ✓Custom check intervals down to 5 seconds
- ✓Dedicated support contact
- ✓Custom SLA and onboarding
See full feature comparison ↓
| Monitors | 50 | 100 | 300+ |
| Team members | 10 | 25 | 50+ |
| White-label status pages | Yes | Yes | Yes |
| SAML SSO | No | Yes | Yes |
| Dedicated support | No | No | Yes |
All plans include a 14-day free trial. No credit card required. See full pricing details →
What MSPs say about Fivenines
Fivenines has been completely reliable...
Fivenines has been completely reliable and the service continues adding features at a fast clip. My subscription just keeps gaining value, which is a great thing!
Mike Horgan
United States · May 1, 2026
Been with the service from ground...
Been with the service from ground floor; the dev is really nice and insanely effective - more than once I've been reporting bugs and assisting with testing while things were being fixed LIVE! It's obvious that he has aspirations and he's been delivering over expectations constantly. The actual product works perfectly along the other monitoring solutions I'm using (currently Hetrixtools and Komari) and for those who are more wary of unknown code running on their prods the code is available via Git. Nothing but recommendations from me!
ZalnT
Sweden · Apr 14, 2026
We have been very happy with Fivenines
The interface is clear and setup was straightforward. Support has been responsive, and alerts arrive promptly when issues arise, enabling quick incident response. Reliability at fair pricing.
Philipp
Germany · Jan 2026
Finally Found a Versatile Server Monitoring at a Sensible Price
After years searching for adequate monitoring tools, Fivenines stands out with its balanced feature set, clean design, reasonable pricing, and genuinely helpful customer support.
T George
Netherlands · Aug 2025
One of the best server monitoring tools I've used
The tool is continuously improving with dedicated developer support. They're responsive to user feedback and I've successfully deployed it as a replacement for our hosting provider's monitoring.
Ahmed
Egypt · Aug 2025
I have been using Fivenines practically since the beginning
The platform has evolved rapidly with attractive pricing and responsive creator support. It's become a solid alternative to larger competitors for our infrastructure monitoring needs.
Lee
Poland · Jan 2026
Finally an affordable and pleasant server monitoring tool!
After several competitors closed or declined, Fivenines emerged as the perfect alternative. Easy installation, fast performance with historical charts. Exactly what I was looking for.
Adrien
France · Sep 2025
Great tool with responsive development
Fivenines has become an essential part of our infrastructure monitoring. The clean interface and reliable alerts make it easy to stay on top of server health.
Dmitriy
Russia · Aug 2025
Frequently asked questions from MSPs
Compare & alternatives
How is Fivenines different from Auvik or LogicMonitor? +
Can I run Fivenines alongside my existing RMM? +
MSP workflows
Can I organize monitors by client? +
Can I white-label status pages with my MSP's brand? +
Does Fivenines integrate with ConnectWise, Autotask, HaloPSA or SuperOps? +
Can I export billing data per client? +
How fast can I onboard a new client? +
Trust & compliance
Is the Fivenines agent really open-source? +
Do you support two-factor authentication and SSO? +
What about compliance: GDPR, SOC 2, ISO 27001? +
What happens at the end of the 14-day trial? +
Ready to monitor your client fleet?
Try Fivenines free for 14 days, no credit card. Or book a 15-minute call. We'll walk through your client setup, answer technical questions and help you decide whether Fivenines fits. No sales pitch.
No credit card · 2-minute setup · Same-day availability for calls
Made in Montpellier · Used by MSPs in 30+ countries · Open-source agent on GitHub